IATA observed largest CTK decline since 1990
Air cargo volumes improved significantly during the course of the year, from the Q2 low point, with global cargo tonne-kilometres (CTKs) down only 0.5% year-on-year in December. However, in 2020 overall, industry-wide CTKs fell by 10.6% year-on-year, the largest decline since our series started in 1990.
World goods trade fell by around 6% in 2020, better than air cargo. While an inventory restocking cycle has started in the later part of the year, benefiting air cargo, capacity constraints are still hampering a fuller recovery.
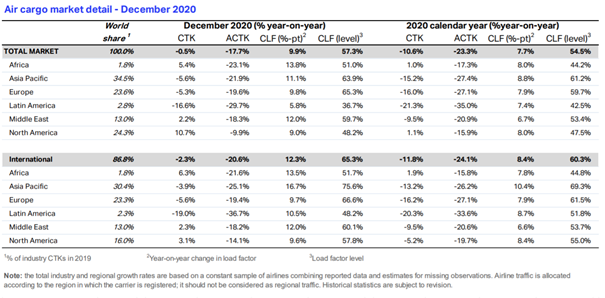
With industry-wide available cargo tonne-kilometres (ACTKs) down 23.3% year-on-year in 2020, cargo load factors, yields and revenues all rose to record-high levels, providing support to airlines and some long-haul passenger services in the face of collapsing passenger revenues. • International CTKs declined in all the main regions except Africa (up 1.9% year-on-year) in 2020.
IATA reports December 2020 seeks best growth performance since November 2019
Air cargo ended on a robust note Air cargo experienced a robust end of 2020, as industry-wide cargo tonne-kilometres (CTKs) declined by only 0.5% year-on-year in December, the best growth performance since November 2019.
This confirms the positive trends already seen in recent months, despite a large decline in November 2020 (6.2%) relative to the same month in 2019. Indeed, seasonally adjusted (SA) CTKs continued to increase at a robust pace, gaining 3.6% compared to the previous month. This places SA CTKs only 2% below levels seen during the previous peak, in November 2019 (Chart 1).
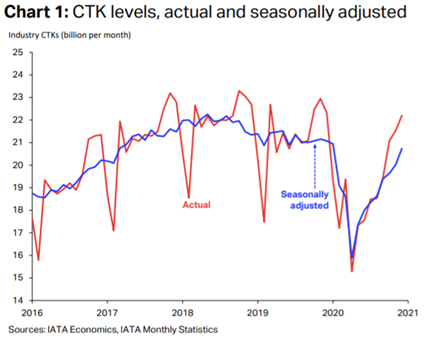
CTK levels, actual and seasonally adjusted During the year as a whole, industry-wide CTKs fell by 10.6% in 2020 versus 2019. This is the fastest rate of decline in our series started in 1990, slightly worse than 2009 (9.7%) but considerably better than passenger traffic.
Air cargo underperformed global goods trade in 2020 In 2020, global trade of goods has declined at a slower pace (6% year-on-year) than air freight. Air cargo typically underperforms other modes of transport during downturns, but the reverse occurs during upturns (Chart 2).
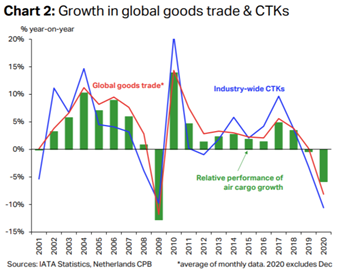
In the early part of the year, lockdowns and other control measures have led to significant disruptions in supply chains and a general fall in economic activity, impacting both trade and air cargo. Manufacturing activity and consumer demand were able to rebound strongly when most lockdowns were lifted in May.
This recovery has continued until the year-end, despite some volatility when renewed COVID outbreaks forced some markets to implement new restrictions. This rebound is well illustrated by global new export orders, with the corresponding Purchasing Managers Index (PMI) crossing the 50-mark in September and remaining above it since then (51.1 in Dec). Global industrial production has also recovered and was close to last year’s value in November.
2020 Air Cargo in March and April resulted in spike ratio for supply chain
The inventory-to-sales ratio – historically strongly correlated with CTKs – offers more colour on the underperformance of air cargo. In March and April, supply chain congestion and lockdowns led to a spike in the ratio. With elevated stocks, shippers did not need to rapidly turn to air freight when demand rose again. This has benefitted ocean trade and other slow modes more than aviation
(Chart 3).
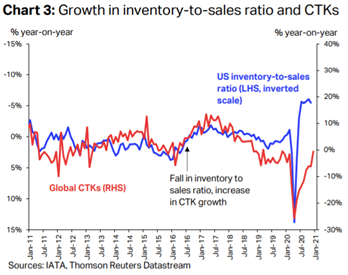
Towards the later part of 2020, inventories started to be depleted. This typically happens at the start of an upturn, and normally leads to strong air cargo performance as businesses need to rapidly refill stocks to avoid shortages.
But during this cycle, available air cargo capacity has been too low to satisfy the raising demand. While ocean transport capacity also suffered from the crisis, this was not to the same extent. This effect is arguably the main culprit for the underperformance of air freight, and offsets positive factors such as the need to turn to air travel for PPE and vaccine shipments. …
Air cargo CTK’s fell down by 23.3% in 2020
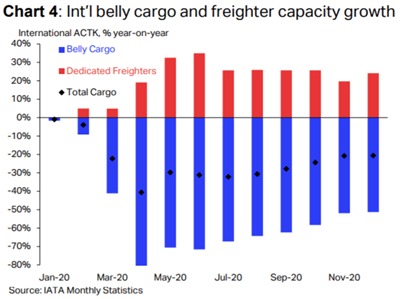
Indeed, industry-wide available cargo tonnekilometres (ACTKs) fell by 23.3% year-on-year (yoy) in 2020 overall. In December, the same metric declined by 17.7% yoy. It has been improving at a slow but consistent pace since Q2 2020.
The lack of capacity has been caused by schedule reductions and aircraft grounding in the passenger market. Prior to the crisis, the bellyhold of passenger aircraft accounted for 60% of total international ACTKs (now around 1/3).
Airlines have raised freighters fleet size and daily utilization of aircraft, which has resulted in a 20.6% yoy increase in dedicated ACTKs over the whole year (24.2% in Dec.). Most of the gains in levels happened during the mid-year 2020 however, and carriers have been unable to fully compensate the lack of belly capacity (down 53.1% yoy in 2020, Chart 4).
2020 performs new all-time-high load factor in December
The industry-wide cargo load factor expanded by 7.7 percentage points (ppts) in 2020 overall, which led to a record-high annual load factor. In December, the total load factor rose by 9.9ppts to a new all-time-high for the month. This was also mirrored in international load factors, as APAC, the Middle East and Nth America also posted records (Chart 5).

A consequence of the lack of space for air cargo has been elevated fares. After reaching a first peak in April and May, cargo yields have increased again during the peak cargo season in Q4. With resilient cargo volumes, this has led to exceptionally high cargo revenues, up 75% yoy in December according to CargoIS data.
Air Cargo volumes decline with 1.8% in 2020
International air cargo volumes declined by 11.8% yoy in 2020 overall, a slightly larger fall than that of total volumes. At the monthly level, international CTKs contracted by 2.3% yoy in December, a robust rebound from the 7.3% decline the month before. With the exception of Latin America, all the main regions registered an improvement (Chart 6).
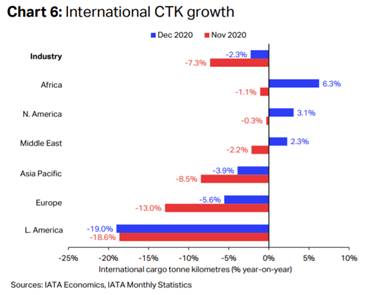
African airlines topped the growth chart both in 2020 overall and in December. Their international CTKs increased by 1.9% yoy in 2020, the only region to accomplish this feat. In December, the same metric grew by 6.3%.
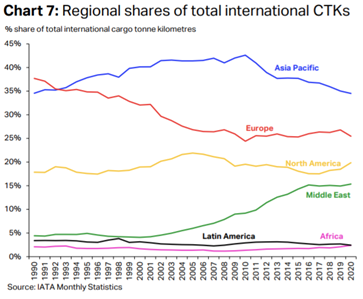
This has allowed African airlines to catch up with Latin American carriers; in 2020 both had similar shares of global international CTKs, at 2.4% (Chart 7).
North America and Middle East doing well
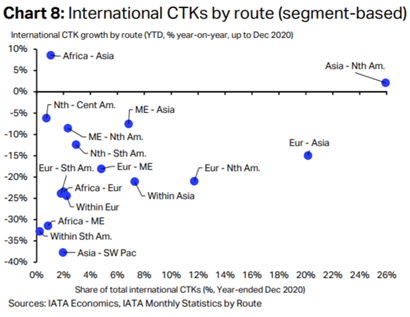
In 2020, international cargo volumes of airlines based in North America dropped by 5.2% yoy, which remains better than the 16.8% decline observed in 2009. In December, growth in the same metric was at 3.1% yoy, the strongest monthly performance since late 2018. This is driven by the Asia-Nth America trade route, up 2.1% yoy in 2020 on the back of strong demand from Nth American consumers for goods manufactured in Asia (Chart 8).
Airlines based in the Middle East posted a 9.5% drop in their international CTKs in 2020 compared to 2019. After a brief pause in November, the recovery in SA volumes has accelerated again in December, with a 5.5% month-on-month gain. …
Asia and Europe face negative performances in December
Asia Pacific airlines registered a 13.2% yoy fall in international cargo volumes in 2020 and a 3.9% yoy fall in December. After a pause in the recovery in Q3, SA CTKs accelerated in recent months, driven by the rebound in manufacturing activity and export orders, notably from China and South Korea. European airlines saw similar air cargo performances.
International CTKs fell by 16.2% yoy in 2020 and by 5.6% yoy in December. SA volumes also paused in November before rising 7.0% month-on-month in December, the most of all the regions. Nonetheless, new lockdowns and adverse economic conditions in the region put this rebound under pressure in the near term. …
Latin American airlines closed the growth ranking
Latin American carriers faced a 20.3% yoy decrease in international CTKs in 2020. The recovery from the nadir of the crisis has been protracted in the region, and SA volumes have gone up and down in recent months. In December, actual int’l CTKs fell by 19.0% yoy, in line with the outcome of November.
The underperformance is explained by difficult economic conditions in markets such as Mexico, Argentina and Peru. The capacity crunch is also stringent in that region, with international ACTKs down 33.6% yoy in 2020, owing to the restructuring of some of the main carriers in the region.
©IATA_AirCargoMarketAnalysis_December2020
Photo: Nieuwsbladtransport.nl