The Danish provider of research & analysis, data and advisory services within the global supply chain industry, Sea-Intelligence has analysed the composite China Containerized Freight Index (CCFI) to see how quickly freight rates could normalise, if using history as a guide.
In the following figure, Sea-Intelligence narrowed down the CCFI to the pre-pandemic data, and identified five periods of sustained rate decreases (marked in red), as well as five periods of sustained rate increases (marked in green).
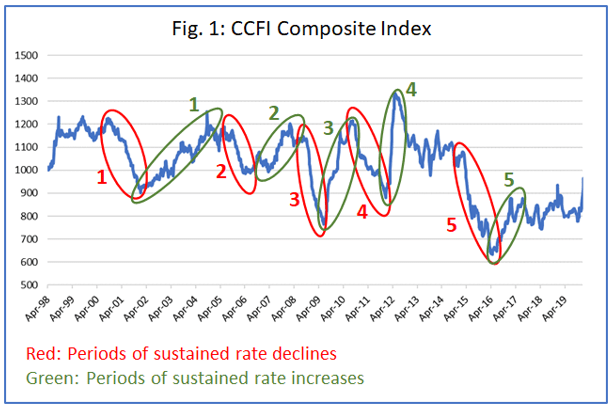
Based on this, Sea-Intelligence analysts defined the time periods of increases and decreases and analysed each separately.
“We measured the rate of decline in terms of the average percentage point drop per week, over the full period of each of the 5 decline periods. This ranged between -0.4% and -0.9% per week. If these time periods are to reflect the inherent pricing mechanisms in the industry, we can use them to calculate a reversal back to normality,” explains Alan Murphy, CEO of Sea-Intelligence.
This, however, presents the next question: what is a normal rate level? Based on historical CCFI data, this is represented by rate levels around index level 1000.
“This represents a decline of -69% from the current rate level,” pointed out Sea-Intelligence.
During the global financial crisis of 2008-2009, rates declined at the fastest rate of a weekly decline of -0.9%, and if we apply this speed of decline to the current rate levels, it would take 18 months to get back to “normal”, according to the analysis.
If, however, the rate of decline matches the average seen over the five rate decline periods, then normalisation would take as much as 26 months. However, it can be argued that the current increase is much stronger than before, and that should be accounted for.
“To do this, we calculated the average weekly rate increases for the five periods with rate increases,” said Murphy.
On average, over the five periods of decline, the rates dropped -0.6 percentage points per week, on average, while over the five periods of increase, we saw rates go up by 1.1 percentage points over the period.
This implies a factor of 1.8 between increases and decreases, meaning that rate increases tend to be 80% stronger, on a weekly basis, than decreases. As the current rate level comes after a 17-month period of sustained rate increases, the result becomes 30 months before a reversal back to index 1000.
Author Antonis Karamalegkos